Assessing Local Business Needs During COVID-19

Assessing Local Business Needs During COVID-19

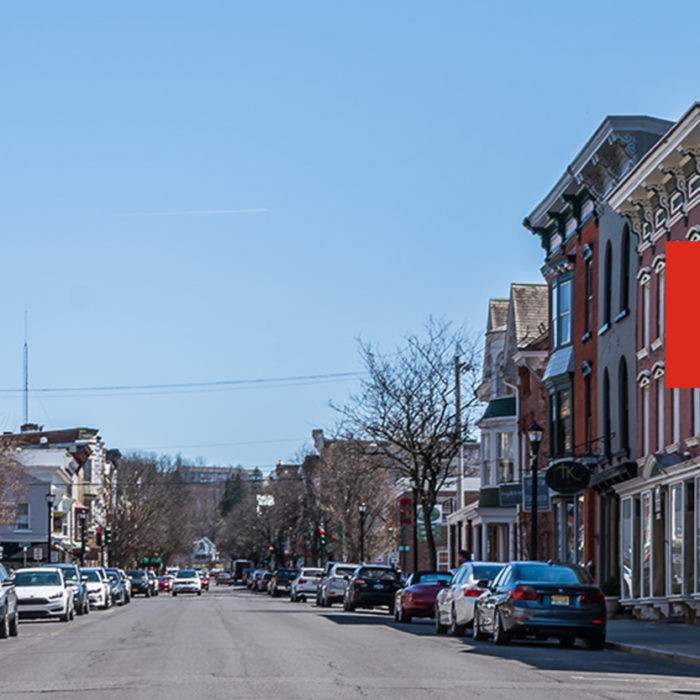
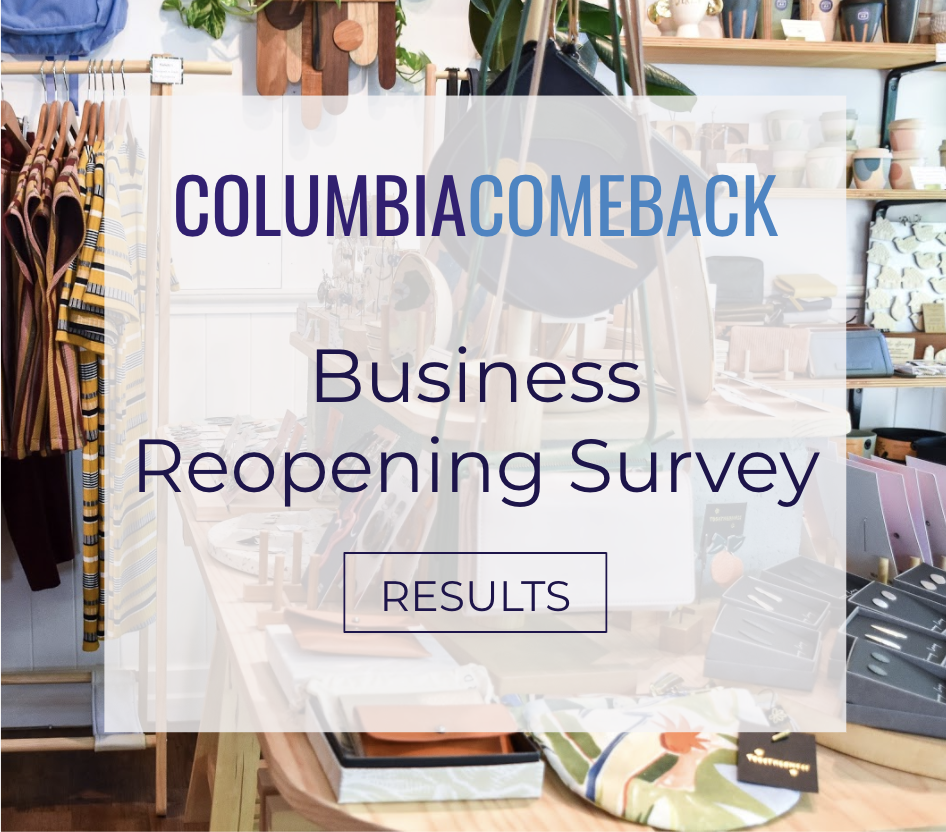
To help the recovery process, ARA supported the local business community in Columbia County, NY by conducting a survey of over 200 public and private entities to assess their status, expectations, and needs for reopening. 

We found that:

►68% of the businesses have been in operation for more than ten years.

►43% are women-owned

►90% were either temporarily closed or reduced operations

The full report can be seen here: ColumbiaComeback – Business Survey Results

As the City of Hudson entered Phase 3 and was about to inaugurate Shared Summer Streets to give businesses more outdoor space to serve customers, The Today Show broadcast this supportive story.

Intelligent Digital Counting at Reopened WTC Cortlandt Street No.1 Subway Station

Intelligent Digital Counting at Reopened WTC Cortlandt Street No.1 Subway Station

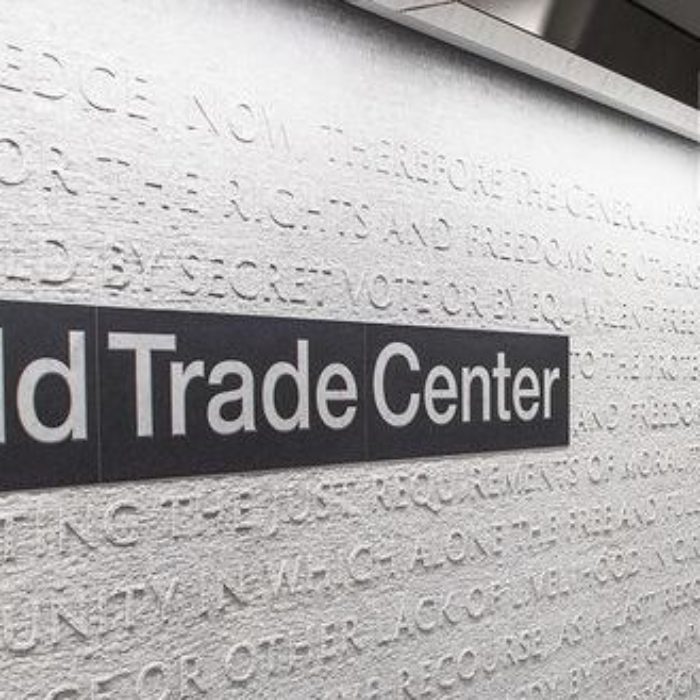
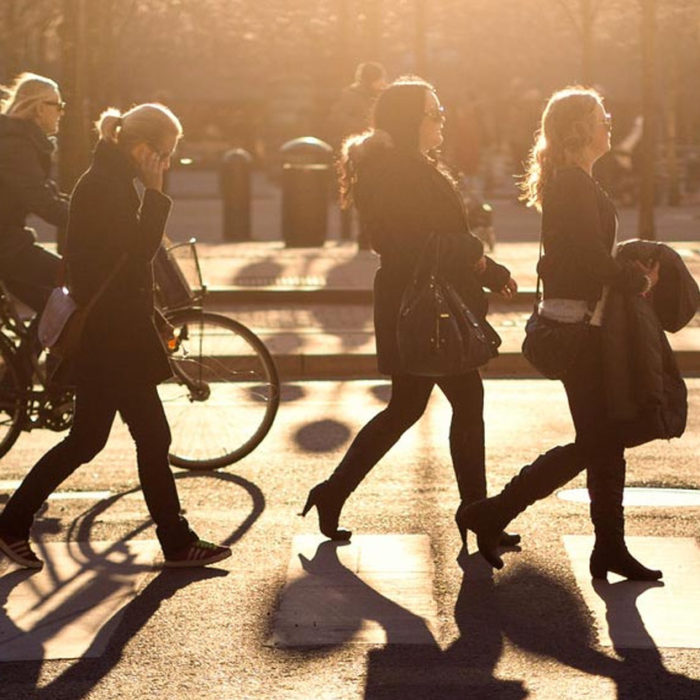
After 17 years, the Cortlandt Street subway station reopened on September 8th 2019.  Westfield World Trade Center retained ARA to deploy its Intelligent Digital Counting (IDC) system (powered by Exteros) that provides pedestrian counts as well as other measures needed by retail such as shoppers’ pace, dwell time, age and gender.  ARA located IDC cameras on two levels in the complex which tracked pedestrian traffic in two waves – before and after the reopening of the station entrances.  The results revealed a statistically significant increase in traffic after the station reopened, especially on weekdays.

Our IDC system uses artificial intelligence (AI) to interpret the data in the camera’s visual field to produce the counts, demographics, dwell time and other behavior. See more on the ARA Services page (https://audienceresearch.com/category/services/).


Queens Botanical Garden

Queens Botanical Garden


ARA surveyed 2,010 visitors between February and December 2018 to update QBG’s 2000 visitor study. Conducted in English, Chinese, Spanish, and Korean, the study revealed an even broader mix of ethnic and racial backgrounds than in the previous study. QBG now draws visitors from a wider geographic base, including increased visitation by Manhattan, Brooklyn, and Nassau County residents. Today’s audience is younger and better educated. Four out of ten who visited, visit with children under 18. Repeat visitors especially valued the relaxing environment and natural beauty of the garden displays and collections.

Surveying at Children's Garden Open House

Vision Zero: ARA Tests Public Response to Mayor’s Safety Initiative

Vision Zero: ARA Tests Public Response to Mayor’s Safety Initiative

When the New York City Department of Transportation needed to gauge public awareness and response to the Mayor DeBlasio’s Vision Zero campaign to promote pedestrian and driver safety, they retained ARA to conduct a citywide poll in English, Spanish and Chinese. When former Mayor Bloomberg’s Office of Film, Theatre & Broadcasting wanted to know public awareness and attitudes toward the Made in New York campaign, they asked ARA to conduct a survey of the City’s registered voters.  With unique access to residential and commercial tenant lists, as well as registered voters in various languages, ARA helps city agencies and non-profits such as NYC & Company, NYC Department of Economic Development, Upper Manhattan Empowerment Zone, and the 9/11 Memorial & Museum understand public perception.

Whitney Museum

Whitney Museum


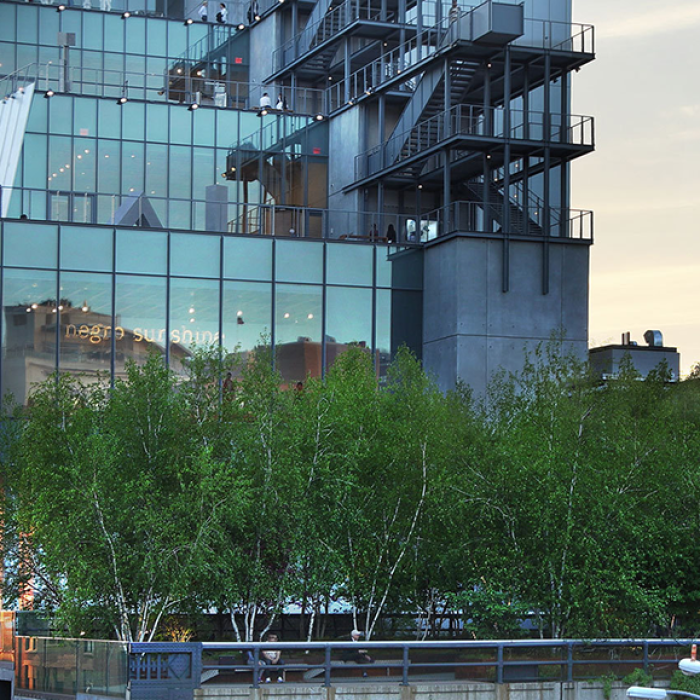
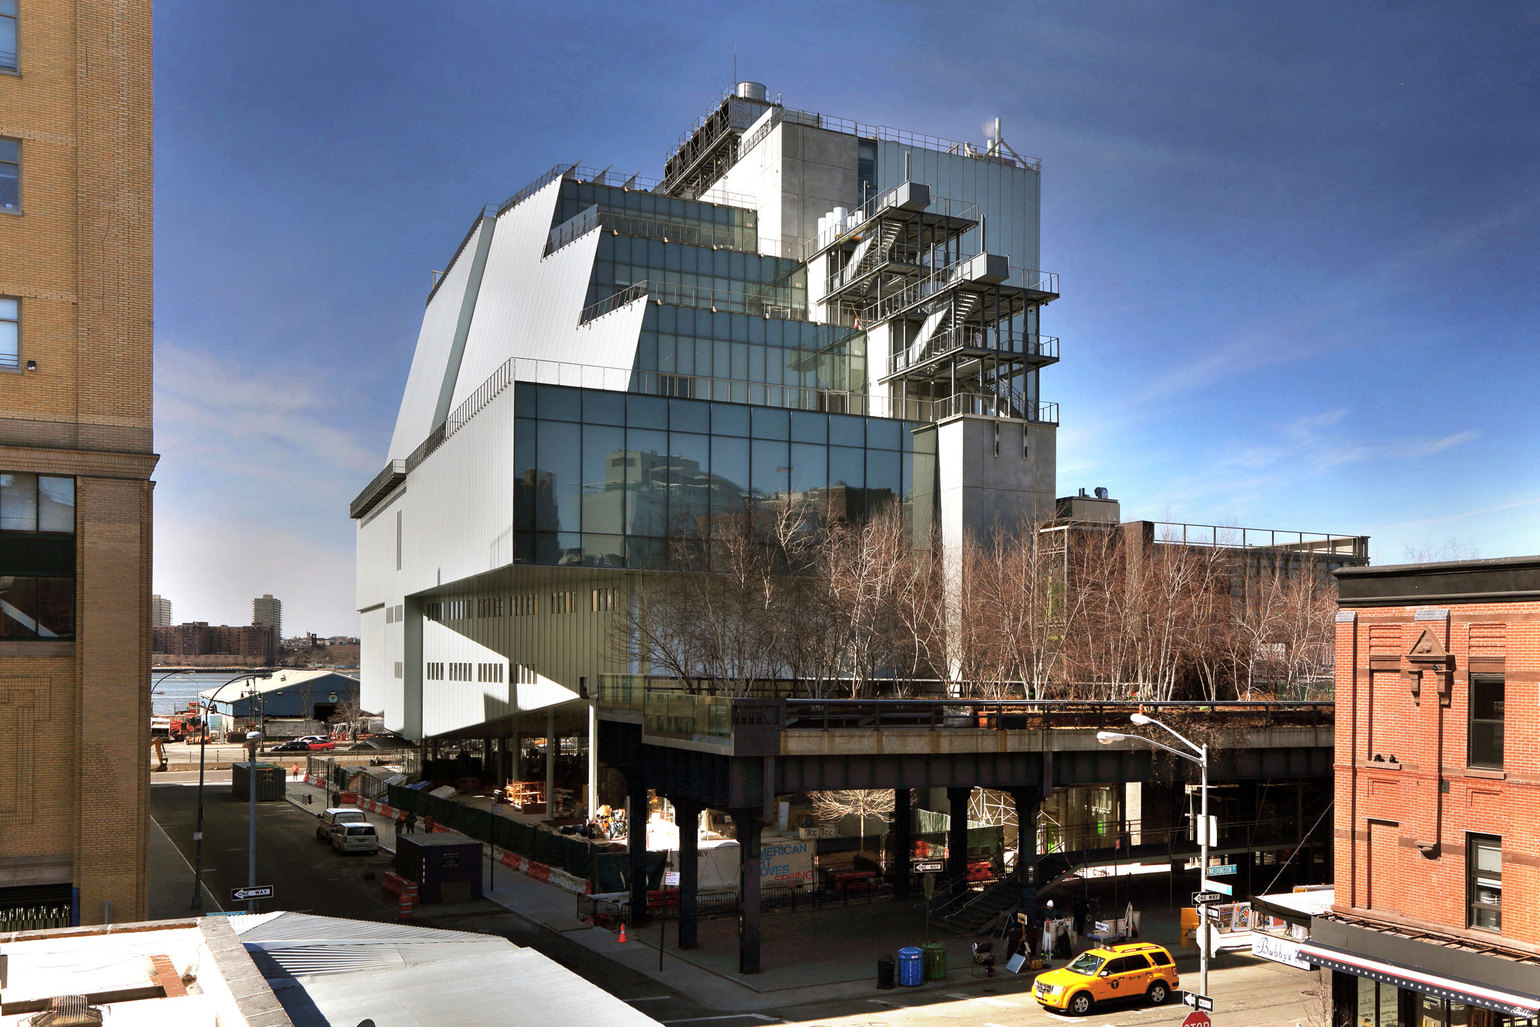
Starting with the Whitney Biennial 2006: Day for Night, and Picasso and American Art in 2007, right up through the opening exhibition in the Meatpacking District, America Is Hard to See, ARA conducted ongoing visitor research for the Whitney.  In addition, ARA helped guide the Whitney’s “engagement-extending” initiatives with real-time studies of how visitors used photography in the galleries and shared their experience on social media.  ARA broke new ground with the Whitney’s first survey on Facebook programmed to reward respondents for sharing that they took the survey on their newsfeed, thereby encouraging others to participate.

ARA conducted its first exploratory survey for the Whitney in the Meatpacking District in 2010.  Interviewing 400 visitors disembarking the High Line and at other locations along Gansevoort Street, the study explored the demographics and lifestyle of visitors as well as their awareness, knowledge of, and history of visiting the Whitney uptown and how likely they were to visit a new Whitney in the MPD.   While nothing could have predicted the successful reception the Whitney is receiving in its new home, this early data shined a light on the potential.  ARA continued studying the evolution of Whitney visitors downtown, including their interest in expanded evening hours, and overall satisfaction.


Signature Theatre

Signature Theatre


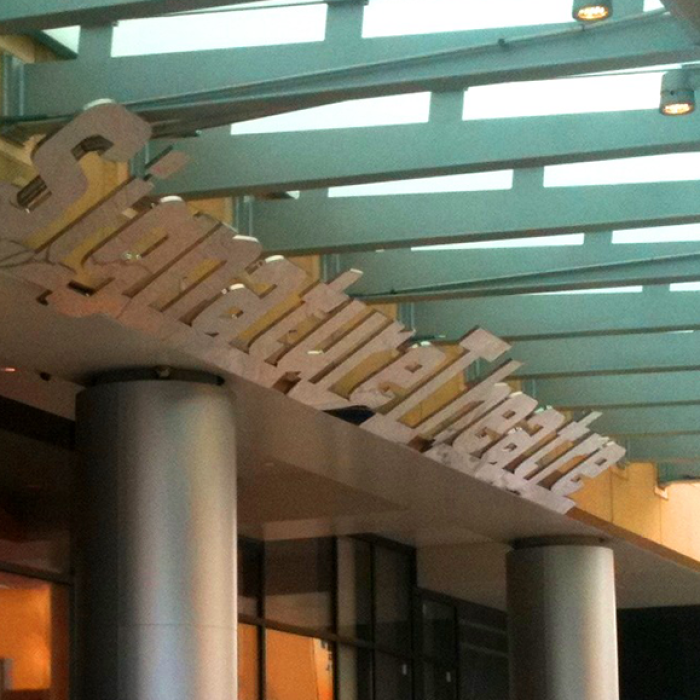
ARA has been tracking the success of the Signature Ticket Initiative since 2005. In a multi-year study of ticket buyers who first came to Signature through the Initiative, Audience Research & Analysis found that 92 percent of respondents cited the subsidized ticket price as “very” or “extremely important” in their decision to attend. By breaking down the economic barrier, the Initiative has consistently attracted new and non-traditional theatre audiences.

The ARA audience survey revealed that over a six-year period:

  • 34% of audiences were NEW to Signature;
  • 24% identified themselves as of color;
  • 15% were under 35;
  • 24% earned under $50,000 annually.

Through this 2016-17 season, ARA continues to tract the success of the initiative in attracting patrons to Signature, encouraging them to return, and inspiring them to contribute.


July 4th Fireworks in Lower Manhattan

July 4th Fireworks in Lower Manhattan

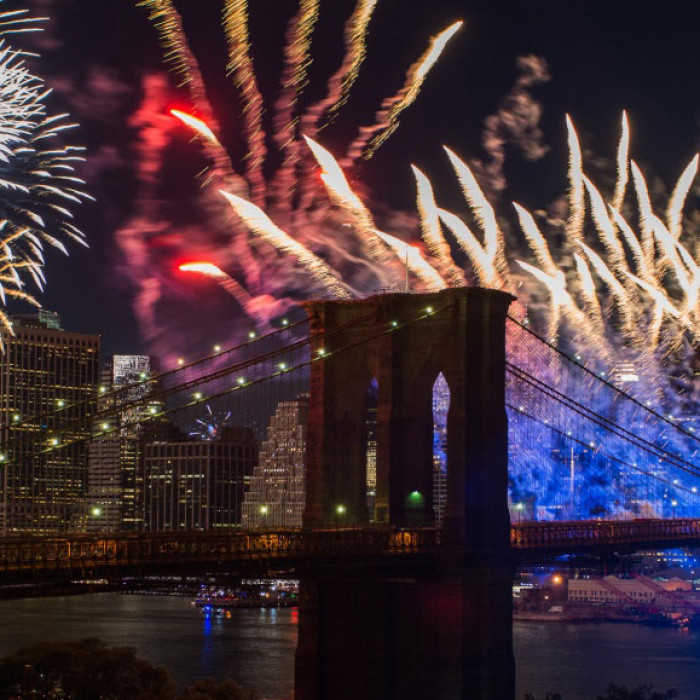
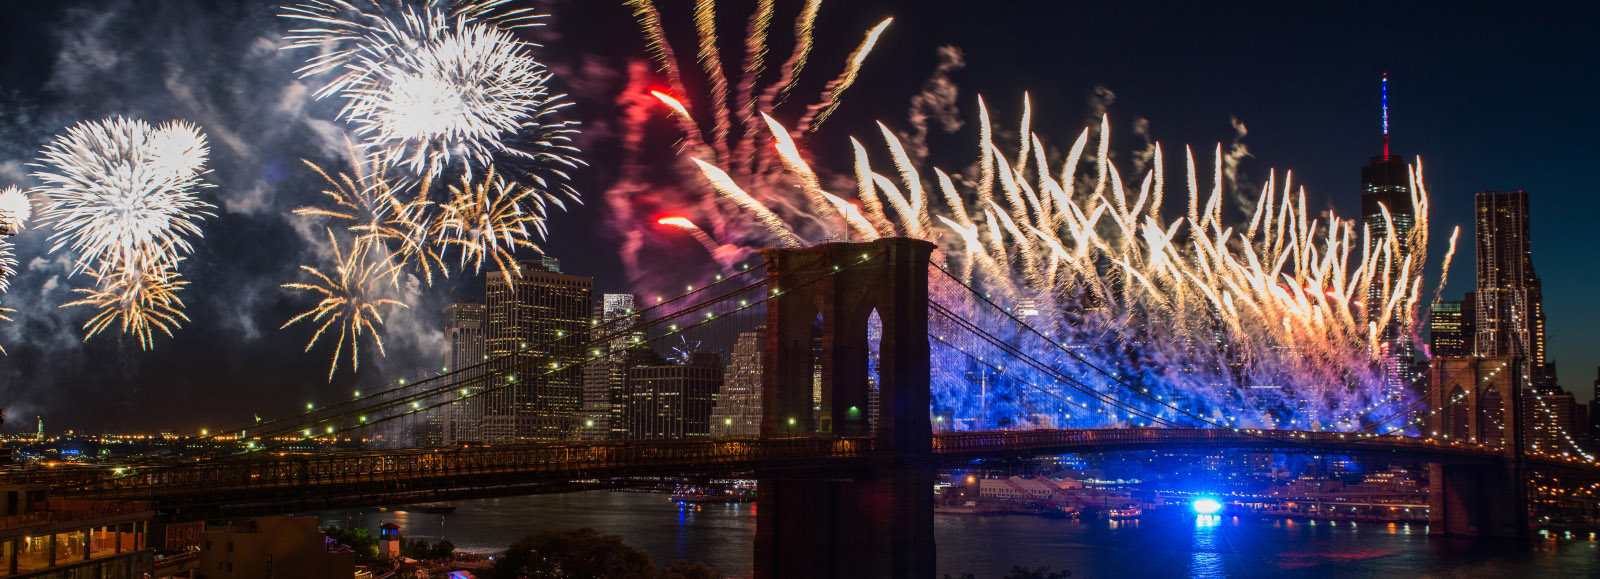
Just how many people come to see the Macy’s Fireworks on July 4th?  If you’re talking about viewing the fireworks close-up from vantage points in Lower Manhattan, the answer is 150,400.  How do we know?  ARA was asked to count all viewers on Manhattan’s east side below the Brooklyn Bridge including those on the FDR (closed six-lane highway), which pedestrians could enter after 4pm from several ramps normally used by cars.  Employing 23 counting staff plus supervisors, ARA assessed visitor traffic in a fluid environment as the NYPD moved barriers and opened different access points to control the crowd. Where crowds moved swiftly, ARA employed multiple counters at the same location, taking the average of their figures to minimize human error.  To the best of our knowledge, this is the first time a comprehensive plan has been put in place accurately measure attendance at a special event of this magnitude.

Impact of Tribeca Film Festival

Impact of Tribeca Film Festival

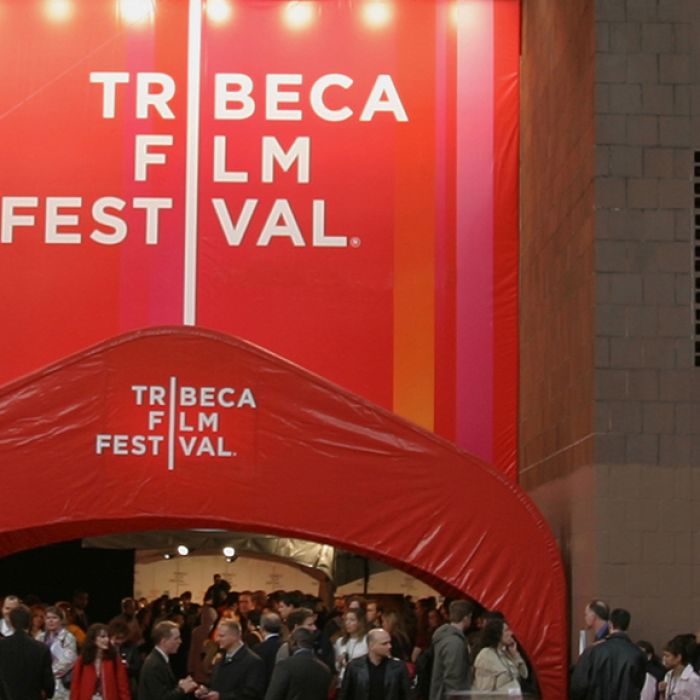
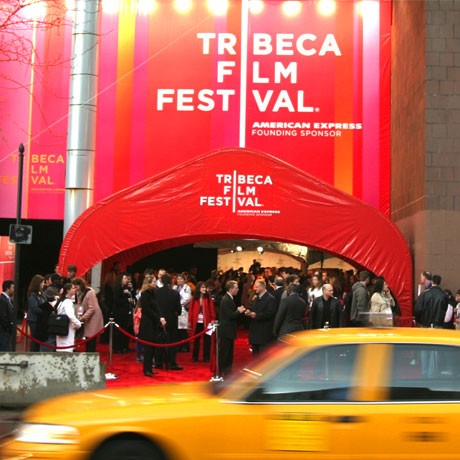
Beginning in 2005, ARA has surveyed attendees at the annual Festival covering all types of ticketed and free events including screenings, panel discussions, red carpet premieres, and the Family Festival Street Fair.

Read More
We have identified the local spending of out-of-town visitors specifically drawn to New York City to attend the Festival and, combined with the Festival’s own New York City production and labor expenses as well as local sponsor-activated expenditure.  Using this data, we estimated the annual economic and tax impacts on the City of New York.

Since its founding, the Festival has attracted 4.9 million attendees from the U.S. and abroad, and has generated more than $900 million in economic activity for New York City.

Working with the Festival’s sponsorship team, ARA has measured the incidence of ownership of products and usage of services at the nexus of entertainment and technology.  These studies of habits and lifestyles have helped the Festival identify and respond to world-class sponsors who want to be connected with this entertainment-savvy audience.  The research showed that the Festival audience offers a unique opportunity to sponsors trying to reach cutting-edge, financial-empowered individuals.

Visitors to Hudson River Park

Visitors to Hudson River Park

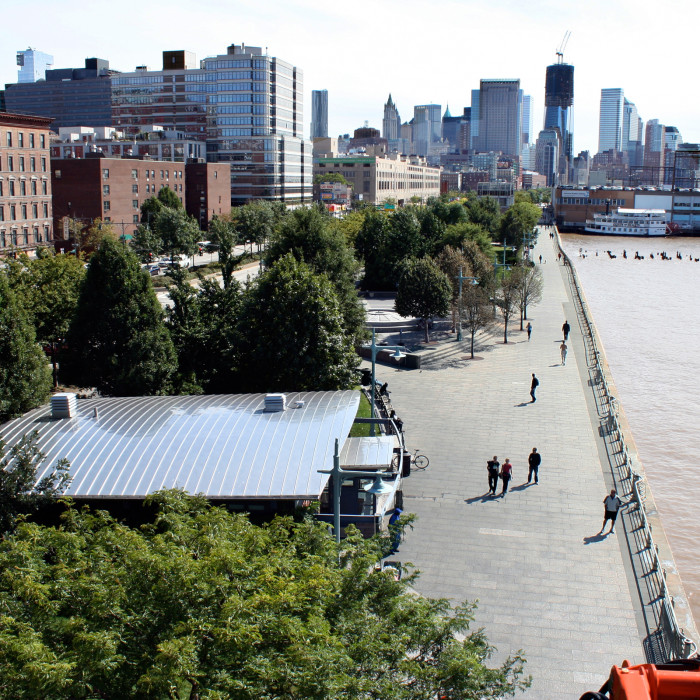
ARA conducted a survey for Friends of Hudson River Park to understand who visited, what they did there, and what changes they would like to see in the future. ARA interviewed 1,288 park visitors from Chambers Street to West 55th Street. Most completed the questionnaire onsite but some chose to go to the dedicated website to respond after their activity in the Park.

Read More
About half of the Park visitors lived in Manhattan, but almost 30 percent were visitors from outside New York City. With a median age of 38 years, park visitors were relatively young. They were also diverse, well-educated and economically upscale. A little more than half were male.

About one-fourth came to HRP to relax while almost one-fifth came to exercise (run, job, or bike). Ten percent came to participate in sports such as basketball, soccer, tennis or kayaking. Almost half came at least at least once a week although one-fifth were visiting for the first time. Among those who had been to the park previously, the three most regularly used features were the running paths, turf lawns for exercise and family activities, and bike paths.

There were several misperceptions about Hudson River Park. For example, one-half believed the Park was part of the NYC Parks Department, which it is not. Four out of ten thought the Park received public funding for its operations, which it does not.

Respondents praised the park, often referring to it as “perfect.” Among the services or amenities visitors desired more of, however, were water fountains and bathrooms, places to eat including coffee and food stands, Wi-Fi, pools/swimming, and information about activities at the park.


Guggenheim Foundation and Museum

Guggenheim Foundation and Museum

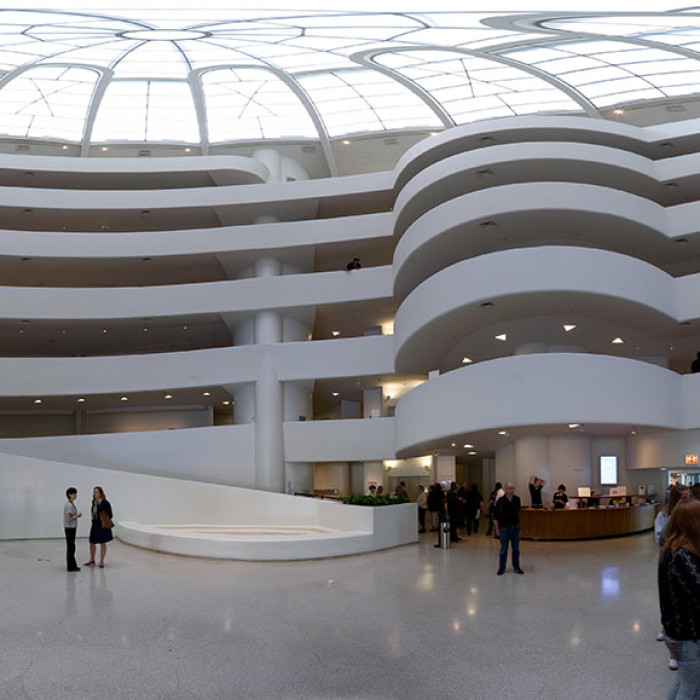
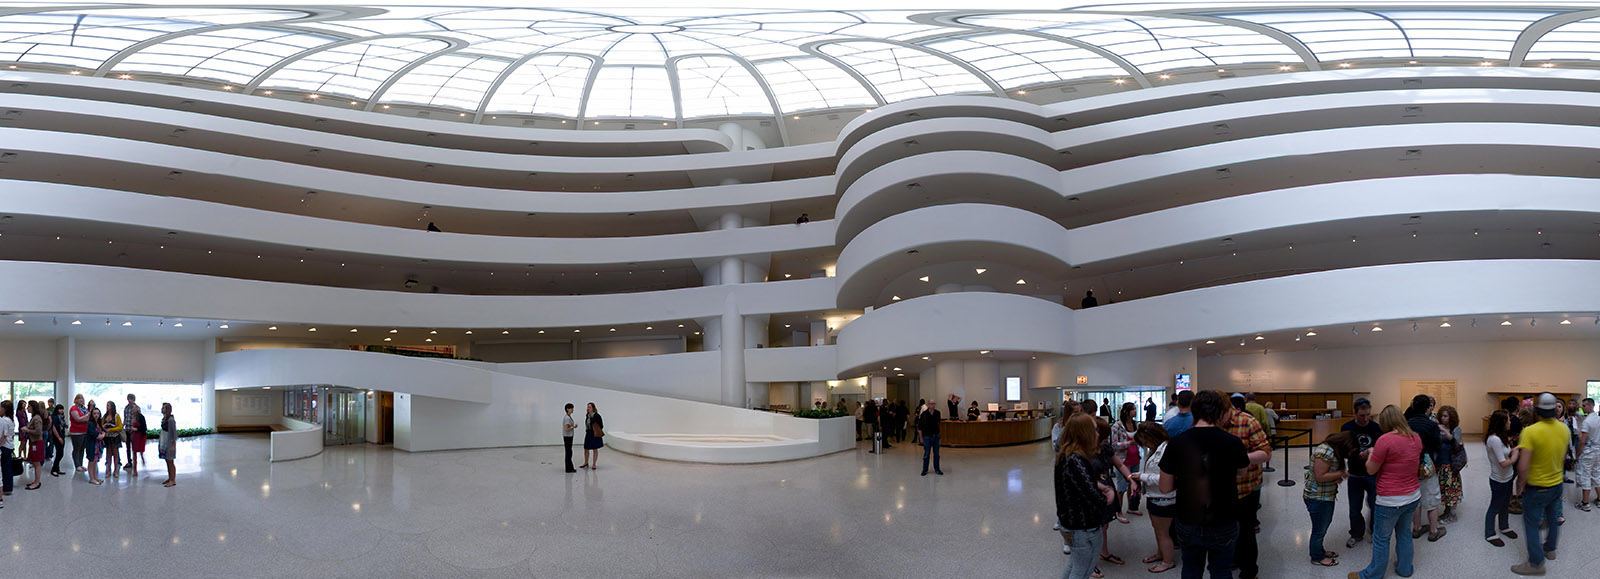
ARA conducted a study for the Guggenheim Museum to better understand the needs and interests of its members.  Conducted online, by telephone, in person and by mail, the research project explored visitors’ reasons for joining and renewing, how they valued current and potential benefits, their use of all types of media (from print and online to social networking), and satisfaction with their experience as members. Read More

It will also included a demographic profile.  A parallel survey of former members explored their experience while members.  The quantitative survey was preceded by qualitative research that included focus groups with members and non-member visitors.